06 Choosing your first stock
Text version
Technical and fundamental analysis
An account with ESKIMO can give you access to more than a million financial products from across the world. How then do you choose what to invest in? Do you rely on your own intuition? Or do you spend time making a thorough analysis?
Fundamental analysis
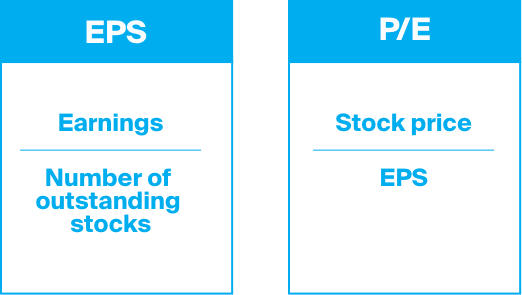
When it comes to buying stocks, there are two schools of thought as to what makes an investment attractive. The first of these, fundamental analysis, is a methodology to calculate the underlying value of a company. Investors use key publicly disclosed figures to calculate whether or not a company is a worthy investment. On your ESKIMO account, many stocks have an overview of such key figures. One example is the Earnings per Stock or EPS of a company. The EPS is the amount of profit earned, divided by the number of outstanding stocks. This number can be used to create different indicators. An example of this is the price-earnings ratio. This ratio is calculated by dividing the stock price by the earnings per stock.
These kinds of figures provide insight into the financial health and profitability of a company. While there is not necessarily a standard benchmark for what is a good or bad ratio, typically it is best to review over a several year period in order to look for trends. Additionally, as valuations can vary greatly between sectors, it is also best to put these figures into context by comparing between firms in a common industry.
Technical analysis
The second method of analysing investment opportunities is technical analysis. While fundamental analysis looks to determine whether a stock is over or undervalued based on company financial data, technical analysis uses statistical indicators to predict a stock’s performance in the market.
One popular example is the use of moving averages as an indicator of price trend. Moving averages take a historical mean for a stock price over a set period of time. This will help to smooth out the day to day price fluctuations and provide a clearer overall trend.
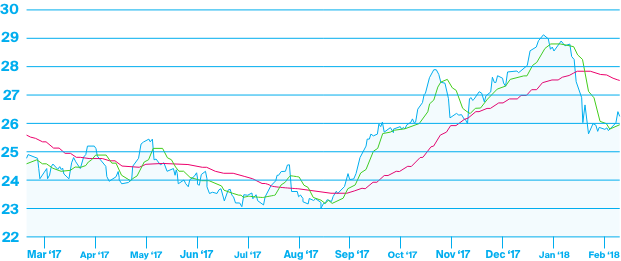
In this example, we see a simple moving average for the price of a stock over a one-year time frame. In addition to the daily price of the stock, we see a 10 day moving average in green and a 50 day moving average in red. As you see, the longer the time frame for the moving average is used, the smoother the indicator gets. This can be used to try and predict the trend of a stock price based on past trading performance.
There are many different ways of looking at historical trading data. Within your ESKIMO account, you will get access to interactive charts, giving you a wide selection of tools that will allow you to make your own analysis.
Making a choice
While fundamental and technical analysis can change the way you think about what to invest in, these methods are by no means the sole determinant of how you should buy a stock. It’s also important to consider if the stock helps to diversify your portfolio. Or you might prefer to invest in companies of which you personally think that they will be successful or have a lot of growth potential. Even firms that you have been satisfied with as a consumer, or that you simply care about could be added. This way, your portfolio becomes a bit more personal.
Coming up
Once you have figured it out, it is time to make a trade. But then there are several order types to choose from. These different options will be discussed in detail in the next lesson.
Start investing today.
Start investing today.
- Incredibly low fees.
- Comprehensive tools, capabilities, and service.
- Worldwide. Anytime and anywhere.
- Secure structure.